Spektrum logger with BladeRF
Posted: Thu Dec 24, 2015 9:40 am
Hi,
at my website http://www.pe2bz.nl/hamradio/skymonitor ... _power.png I have a spectrum from 400 - 406 MHz showing the last 8 hours of activity in the EU radiosonde frequency band. It's running with an RTL-SDR stick and the rtl_power tool and it gives the 30 second average signal values on each frequency. Those (csv) values are converted by a script to the png file.
I also want to run this for the 1680 MHz sonde band. However the RTL dongles are not very good on those frequencies.
I try to find a tool which can create such images with the use of the BladeRF. I tried the bladerf-cli and can indeed (running a script) create an CSV output file, but running the bladerf-cli within Windows does not give me the possibility to make a fifo as is described on this page https://github.com/Nuand/bladeRF/wiki/b ... and-Tricks
Is there anyone who can help me with this ?
Thanks in advance,
Ben - PE2BZ
at my website http://www.pe2bz.nl/hamradio/skymonitor ... _power.png I have a spectrum from 400 - 406 MHz showing the last 8 hours of activity in the EU radiosonde frequency band. It's running with an RTL-SDR stick and the rtl_power tool and it gives the 30 second average signal values on each frequency. Those (csv) values are converted by a script to the png file.
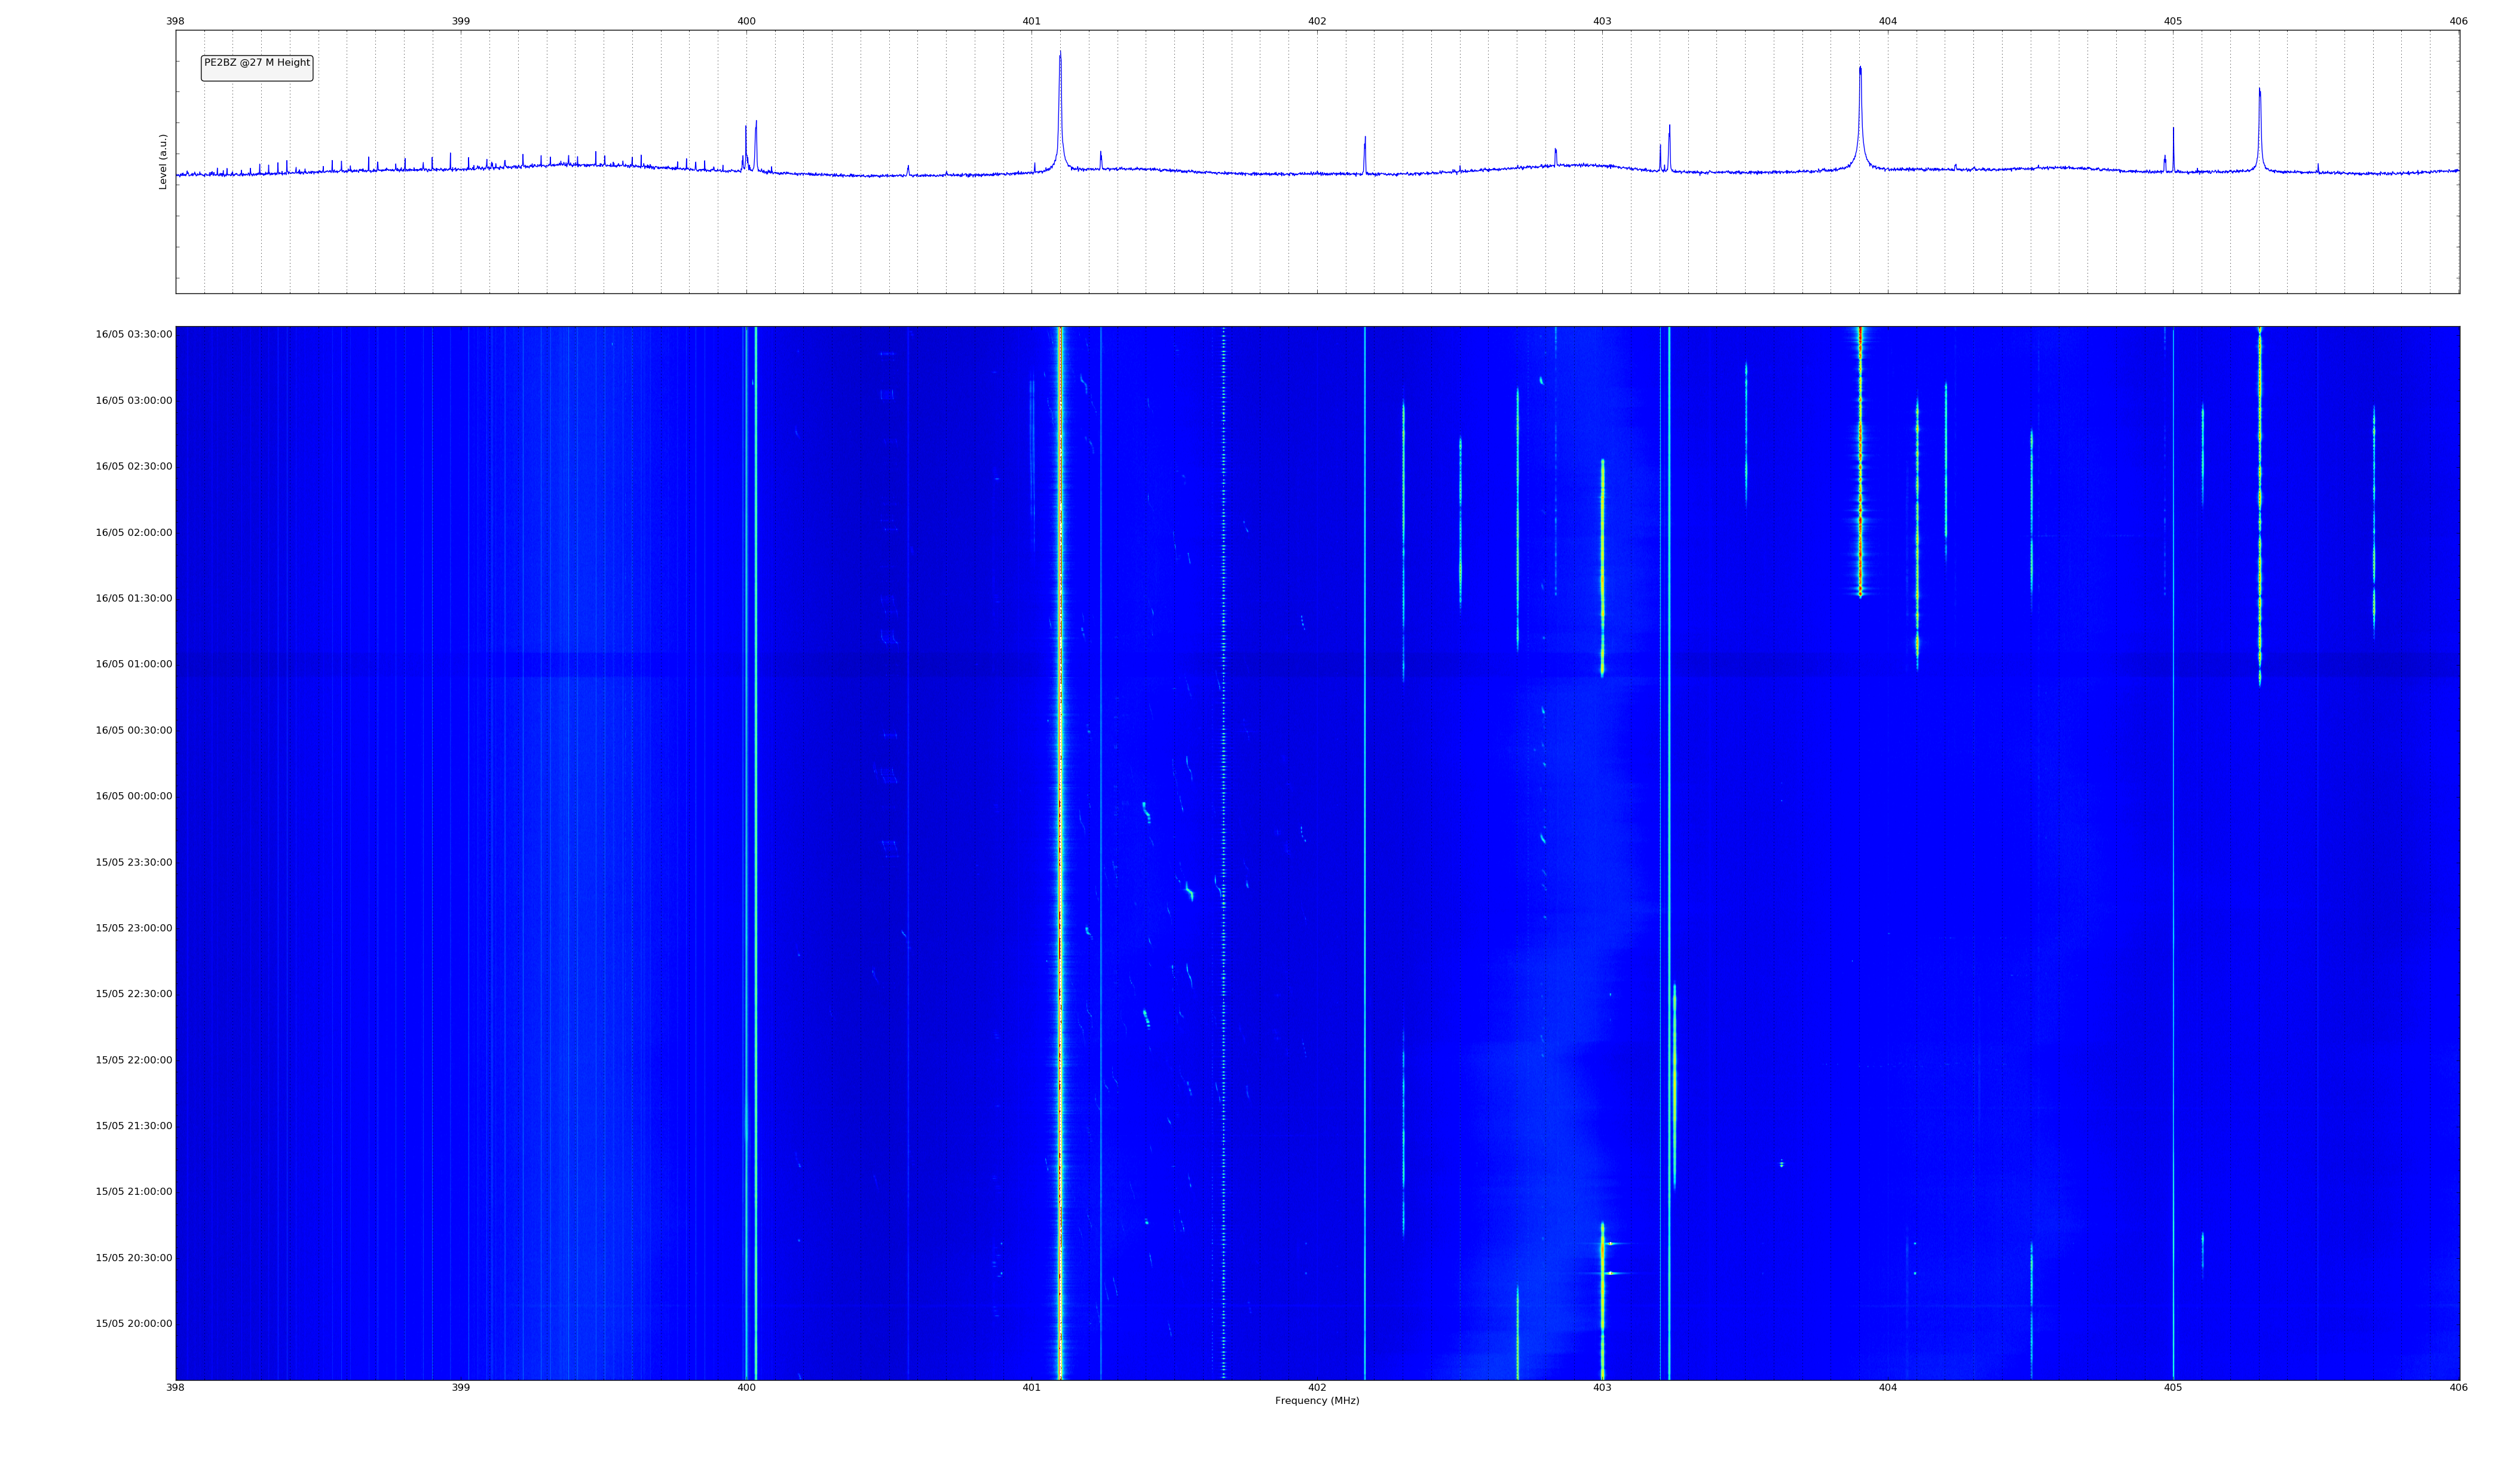
I also want to run this for the 1680 MHz sonde band. However the RTL dongles are not very good on those frequencies.
I try to find a tool which can create such images with the use of the BladeRF. I tried the bladerf-cli and can indeed (running a script) create an CSV output file, but running the bladerf-cli within Windows does not give me the possibility to make a fifo as is described on this page https://github.com/Nuand/bladeRF/wiki/b ... and-Tricks
Is there anyone who can help me with this ?
Thanks in advance,
Ben - PE2BZ